If you’re a web development agency like us, hosting a growing number of clients in the cloud, you may sometimes feel like this guy with the balls in the
air.

That can be especially true when it comes to managing resource costs in Amazon Web Services. Don’t get me wrong: I love
that we can spin up an array of servers at a moment’s notice with minimal fuss. It’s one of the greatest reasons to use AWS.
But I also love feeling in control of the costs so that I’m successful not just as a technologist, but as a business asset too.
I do often think that Amazon doesn’t understand the agency model. Maybe they’re more focussed on the Netflix’s of this world. I understand, I love Netflix dearly. But for the benefit of others in the same kind of boat as us, I’m going to spell out how we adapted the AWS cost analysis tools to meet agency needs. If you’ve read my previous posts, you’ll be aware for example that we use a range of linked AWS accounts to help manage access to the resources of various clients. In that post, I touched briefly on the ability to manage billing centrally. This post applies just as much to a single AWS account with many resources, as to a central account with many resources in many linked accounts.
If you’re like us, you have individually tailored hosting agreements with a wide range of clients. We’ve got a lot of different kinds of balls to keep track of. Some of our resources will be in the air for a month, some for several years. Many will change size and type as clients grow. Almost everything will need to be upgraded over time, as new resource types are invented. Life in the tech industry never sits still.
Those factors mean that we can’t just add up the number and type of resources in play, and reserve capacity for the next year. If we reserve capacity incorrectly, our costs are going to be… Uncomfortable. If we reserve the wrong resource type without being aware of a mismatch, we pay double.
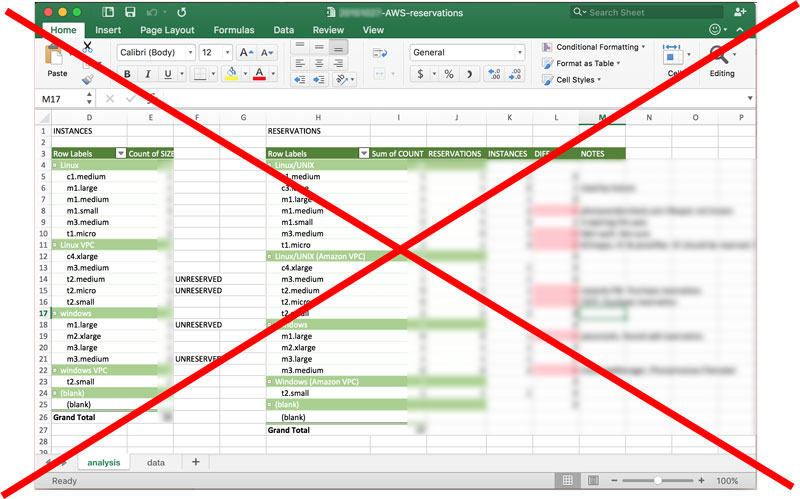
Thankfully, Amazon hasn’t just given us the tools to incur costs; They have begun giving us the tools to analyze those costs too. I don’t need to copy and paste resource lists into spreadsheets every month, vainly attempting to avoid missing details in PivotTable hell. Hurray! The AWS tools actually helped me find cost wastage that I could not have identified by manually collating instances with reservations.
Let’s look at two key tools used to manage costs for the Elastic Compute Cloud (EC2) service. Both can be found by navigating to Billing & Cost Management, then Reports. Especially wonderful is the fact that these reports grab data from any linked accounts, so you don’t need to jump between accounts in order to identify resources.
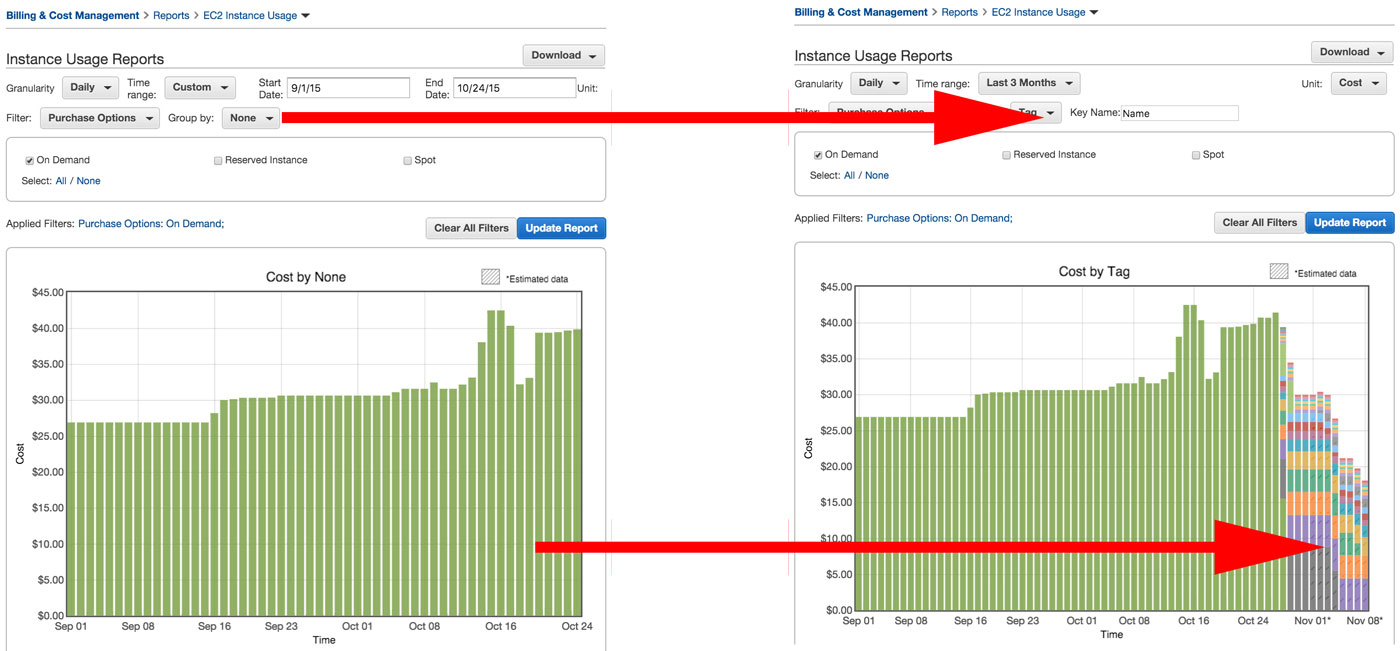
The Instance Usage Report is great because we can identify instances that are running on-demand, which is the most expensive purchase option. By applying the Purchase Option filter, we can very quickly get an understanding of how much money we’re spending on un-reserved instances.
Jeff Barr’s blog post introducing this report demonstrates the ability to group by instance type, which is great when you’re just dealing with a mass of instances that fit the same usage profile. But what really super-powers this report for agencies, is grouping the data by client tag or even by an instance-specific tag like Name. EC2 instances actually have the Name tag built-in. So we can hover over each color in the graph below and identify specific instances that are running on-demand.
I found this technique immediately useful. We just about cut in half the value of servers running on demand. We identified running servers that were in tucked-away corners of linked accounts. We even identified some servers that we were sure were reserved, but in fact did not match the reservations we had purchased. It turns out that was a surprisingly easy mistake to make, since there are a variety of licensing options for Windows instances and those specifics are not identified on the instance details in the AWS console. Oops. The AWS billing support crew were helpful in correcting the situation, once identified.
If you’re following along with your own AWS account open in another tab, you might be trying in vain to group by tag. If so, head over to the Cost Allocation Tags page in the Billing & Cost Management section, and check the box next to the tag(s) you want to be able to group by. Unfortunately, tags are only applied to usage data from the date that they were allocated as cost tags, as you can see in the screenshots above. So apply tags as early as possible. We suggest at least the following: name and client.
One great outcome of this audit was that we discovered some AWS foibles that were costing us. One was an inconsistency in the AWS documentation: Availability zones don’t match physical locations between accounts. “us-east-1b” in one account could actually be “us-east-1c” in another., Bbut they do align when linked for billing, you can always assume B is really B. So when we had an instance in a linked account in one zone, and a reservation in another account, we didn’t originally think we had any way of matching the two together. It turns out we needed to modify the reservation. A second foible was encountered when we tried to change the zone of a reservation to match an instance in a linked account. The modification was silently rejected by AWS without a notification, and we only noticed the rejection during our audit process.
Once identified of cost issues barriers, the billing support crew were helpful – but without us identifying the issue, we would have continued to waste money.
[more]