In this age of data, endless supplies of information can be accessed with just a click of a button. But most of us have no idea what to do with all of the information available. One area confusing marketers is how to grab actionable insights from our site data. Whether you are a Google Analytics pro or novice, we all know that surfing through analytics can be difficult. Let’s do a quick test of our Google Analytics prowess:
- Are you using Google Tag Manager or event tracking?
- Have you setup Goal Funnels to track how users are flowing through your site?
- How many users are visiting your website more than once? How long is the time gap between visits?
- Have you assigned page value to your pages to determine how valuable each page is to your KPIs?
These are some basic questions we review when starting analytics consulting with our clients at emfluence. A brand manager may understand KPIs, but organizing Google Analytics around relevant KPIs is an entirely different task. The use of dashboards, custom reports, and shortcuts will help understand how we are trending toward our KPIs, but each report only shows a small portion of our overall marketing strategy. What about our email open rate? Facebook advertising? Display campaign performance? Google Analytics can help with our on-site data, but how can we get a holistic view of all marketing efforts? This is where we need to start utilizing API’s and digital dashboards to take our analytics to the next level.
The All-In-One, Mega Dashboard
The case with some of our brand partners is that they utilize a variety of sources for their marketing efforts: branding, digital marketing, PR, and traditional media placement. When all of this data is landing in a marketing manager’s lap, in a different formats, it can take days to sift through all of the data. Not to mention the need to have meetings with each of your marketing partners just to understand the data.
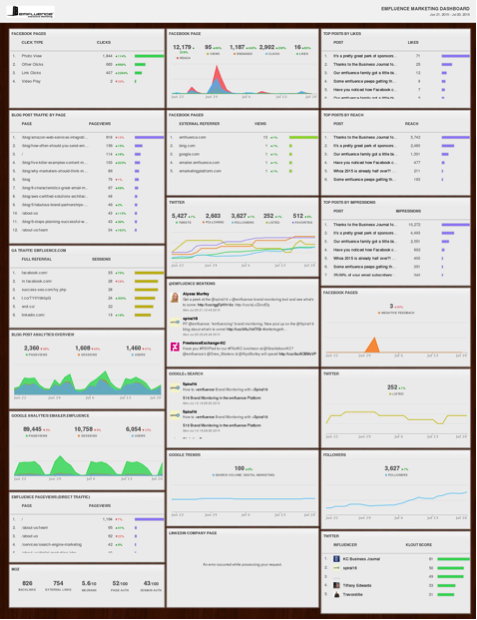
We encountered this issue with one of our partners, DaVinci Roofscapes. As the friendly neighborhood digital marketing agency, we were happy to help the DaVinci team get all of their marketing efforts on the same page. Here’s how we broke down a 6-month, multi-level campaign into one easy to understand digital dashboard that can be exported into a simple 3-page .pdf:
Step 1: Get all of the marketing teams into a Google Drive account
Step 2: Connect Google Analytics, Google AdWords, DoubleClick, the eMarketing Platform, Google Webmaster Tools, Facebook Ads, Twitter, LinkedIn, Pinterest, and Google Sheets to the emfluence Analytics Dashboard.
Step 3: Set a date for all teams to upload all analysis and unique data (such as workflows or Competitive Site Audits)
Step 4: Import unique data
Step 5: Export a beautiful .pdf for DaVinci’s marketing manager to show off her success!
The Content Dashboard
Want to spot trends in competitor email campaigns? Or spot trends in competitor blogs? Use a competitive content dashboard to store all of your writing prompts in one place for when you create your content calendar.
In addition to gathering competitive content in this dashboard, you can hook your key influencers into the dashboard to see who is pulling the most weight for your organization (a monthly competition we hold here at emfluence).
The C-Level Dashboard
Need a quick way of communicating how your marketing efforts are paying off? Bust out your most important e-commerce metrics in a quick, easy to understand dashboard that can help your entire team understand what is bringing in your revenue. Key metrics needed for your bosses’ boss:
- Overall traffic by medium
- Top locations of converters
- Cost per acquisition
- E-Commerce Overview
- Goal Conversion Rate
- Top Selling Products
Providing a simplistic dashboard for your team is a great way of helping everyone quickly understand how your campaign is trending and where you should be investing additional funds.
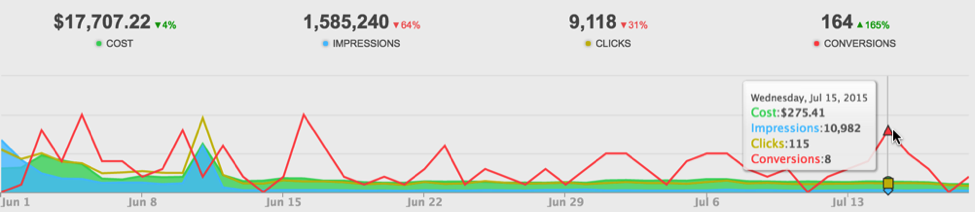
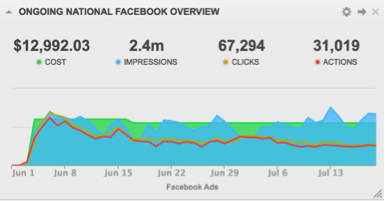
PPC Quick View
The need for an up-to-date understanding of PPC trends is imperative for enterprise-level paid search campaigns. Whether you are utilizing only AdWords or a full suite of paid media, a PPC dashboard can provide all of the necessary data to understand how your paid search campaigns are impacting the bottom line. Directly connecting to AdWords, Facebook Business Manager, DoubleClick, most display networks, and Bing Ads can directly feed your dashboard with up-to-the-minute information on ad groups, keywords, and cost per action.
Bringing It All Together
Digital dashboards are sweeping business analytics teams as an amazing way of providing all necessary data in one location. Is your organization utilizing digital analytics insight to get a leg up on your competitors? Want to learn more about how digital analytics dashboards can save your team time and money?
Check out our sample dashboard at http://emfl.us/BAMd then contact an emfluence business development representative to get the ball rolling on your digital marketing dashboard today!
[more]